If you have ever opened a trading platform and stared at the flashing red and green numbers, you have seen an order book in action. For many beginners, it looks confusing. Rows of prices, quantities, and constantly changing figures can feel overwhelming.
Yet the order book is one of the most powerful tools in trading. It shows real-time supply and demand. It reveals where buyers are willing to step in and where sellers are ready to exit. When you understand how to read it, you stop guessing and start making informed decisions.
This guide will walk you through how to read order books on exchanges. You will learn about order types, market depth, bid-ask spread, slippage, and practical examples of trades. By the end, you will be able to interpret buy and sell orders with confidence and understand what the numbers actually mean.
What Is an Order Book?
An order book is a real-time electronic list of buy and sell orders for a specific asset on an exchange. It is commonly used in stock markets, cryptocurrency exchanges, forex platforms, and derivatives trading.
The order book is divided into two sides:
- The bid side, which shows buy orders
- The ask side, which shows sell orders
Each side displays prices and the quantity available at each price level. The highest bid and the lowest ask are the most important numbers because they represent the best available prices in the market at that moment.
Think of the order book as a live negotiation board. Buyers post the highest price they are willing to pay. Sellers post the lowest price they are willing to accept. When both match, a trade happens.
Understanding Buy and Sell Orders
Before diving deeper into the order book, you need to understand the main order types that appear in it.
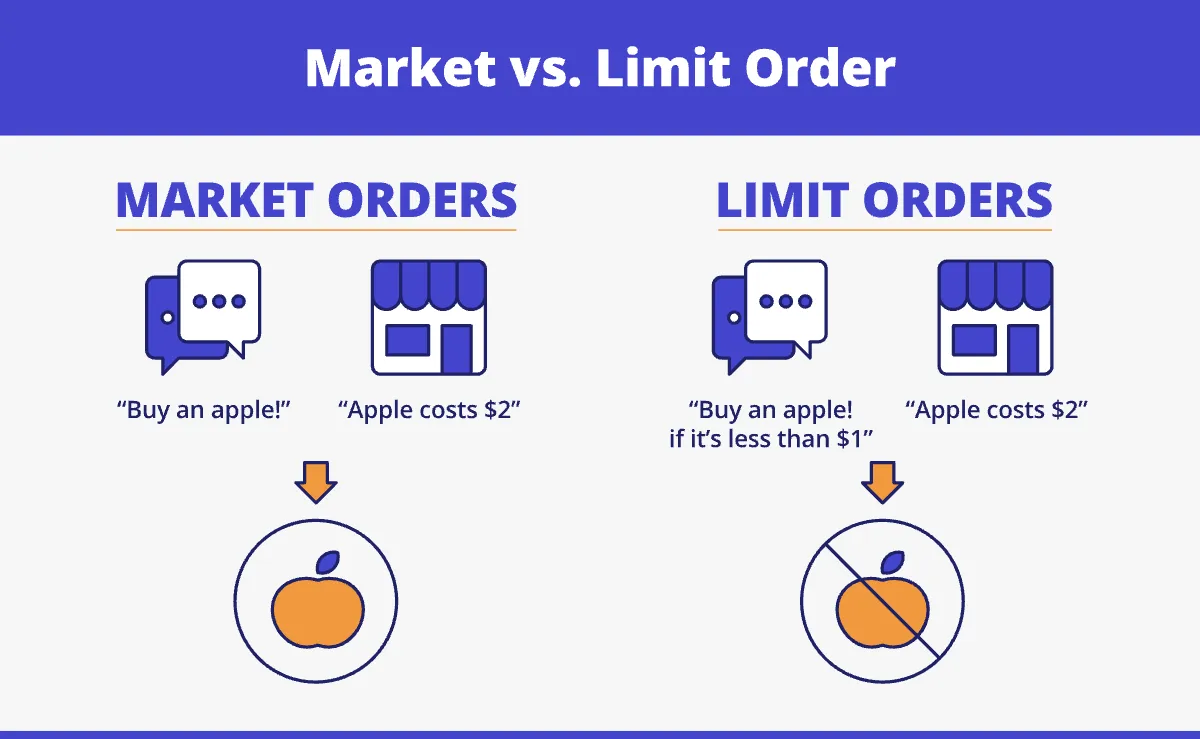
Market Orders
A market order executes immediately at the best available price.
If you place a market buy order, you agree to purchase at the lowest available ask price. If you place a market sell order, you agree to sell at the highest available bid price.
Market orders prioritize speed over price control. They are useful when you want instant execution, but may result in slippage if liquidity is low.
Limit Orders
A limit order allows you to set the exact price at which you want to buy or sell.
For example:
- You place a limit buy at 100
- The current price is 105
- Your order will only execute if the price falls to 100
Limit orders appear in the order book and add liquidity to the market. They are visible to other traders and contribute to market depth.
Stop Orders
Stop orders activate when the price reaches a specific trigger level. They are often used to limit losses or enter trades during breakouts.
For example:
- You set a stop loss at 95
- If the price drops to 95, your stop order becomes a market order
Stop orders usually do not appear in the visible order book until triggered.
Understanding these order types is essential because the order book mainly reflects pending limit orders, not market orders that execute instantly.
Structure of the Order Book
A typical order book has three main columns:
- Price
- Quantity
- Total or cumulative size
The bid side usually appears in green and is sorted from highest to lowest price. The ask side appears in red and is sorted from lowest to highest price.
The top of the book shows:
- Best bid, which is the highest buy order
- Best ask which is the lowest sell order
The difference between these two is known as the spread.
What Is the Bid Ask Spread?
The bid-ask spread is the difference between the highest bid price and the lowest ask price.
For example:
- The highest bid is 100
- Lowest ask is 101
- Spread is 1
A tight spread usually indicates high liquidity and active trading. A wide spread may indicate low liquidity or uncertainty in the market.
For traders, the spread is important because it represents an immediate cost. If you buy at the ask and instantly sell at the bid, you lose the spread amount.
Professional traders often watch the spread closely to judge market efficiency and volatility.
Market Depth and Liquidity
Market depth refers to the volume of buy and sell orders at various price levels. It shows how much of an asset can be bought or sold without significantly affecting its price.
A deep market has large quantities of orders on both sides. A shallow market has small quantities, meaning prices can move sharply with relatively small trades.
Let us consider an example.
Suppose the order book shows:
Bids:
- 100 for 500 units
- 99 for 800 units
- 98 for 1,200 units
Asks:
- 101 for 400 units
- 102 for 700 units
- 103 for 1,500 units
If you place a market buy order for 300 units, it will be filled at 101. The price impact will be minimal.
But if you place a market buy for 1,000 units, the order will consume:
- 400 units at 101
- 600 units at 102
Your average price will be higher than 101. This is called slippage.
The more depth there is near the current price, the less slippage you are likely to experience.
What Is Slippage?
Slippage occurs when your order executes at a different price than expected.
It usually happens in two situations:
- When placing large market orders
- During high volatility
Slippage can work against you or in your favor, but in fast-moving markets, it is typically negative.
For example, you click buy at 100, but by the time the order executes, the best available price is 102. That 2-point difference is slippage.
By checking the order book depth before placing a trade, you can estimate potential slippage.
Reading Order Book Signals
Many traders attempt to read patterns within the order book to anticipate short-term price movements. While it is not a crystal ball, the order book does provide clues.
Here are some common observations:
Large Buy Walls
A buy wall occurs when a large limit buy order sits at a particular price. It may act as temporary support because sellers must absorb that volume before the price can fall further.
Large Sell Walls
A sell wall is a large limit sell order at a certain price. It can act as resistance because buyers must absorb that supply to push the price higher.
However, keep in mind that large orders can be canceled at any time. Some traders place fake walls to influence sentiment, a tactic sometimes referred to as spoofing in certain markets.
Sudden Imbalance
If the bid side becomes significantly larger than the ask side, it may indicate stronger buying interest. Conversely, a heavier ask side may suggest selling pressure.
Order Flow Speed
The speed at which orders appear and disappear can signal momentum. Rapid execution on the ask side suggests aggressive buying. Rapid execution on the bid side suggests aggressive selling.
It is important to combine order book analysis with price charts and volume data. The order book shows intent. The trade history shows actual execution.
A Simple Trade Example
Imagine a cryptocurrency trading at 50.
The order book shows:
- Best bid 49.95 with 2,000 units
- Best ask 50.05 with 1,800 units
You believe the price will rise soon. You have two options.
Option one, place a market buy. You immediately buy at 50.05.
Option two: Place a limit buy at 49.95 and wait. If the price dips, you get filled at a better price. If not, you may miss the move.
By reading the order book, you understand where liquidity sits and can decide your strategy based on urgency and risk tolerance.
Beyond the basics, learning how to read order books effectively requires context, discipline, and practice. Numbers alone do not make a strategy. Interpretation is what creates an edge.
Advanced Order Book Concepts
Once you understand spreads, depth, and order types, the next step is recognizing how professional traders use this information in live markets.
Order Flow and Trade Tape
While the order book shows pending limit orders, the trade tape shows completed transactions. Watching both together provides a clearer picture.
For example:
- If you see large sell orders sitting on the ask side but trades continue to execute aggressively at the ask price, it suggests strong buying pressure.
- If buy orders appear large but trades consistently execute at the bid, sellers are dominating.
Order flow analysis focuses on who is more aggressive, buyers or sellers. Aggressive participants use market orders. Passive participants use limit orders.
If aggressive buying keeps absorbing sell orders, the price often moves upward. If aggressive selling keeps hitting bids, the price may move downward.
The key idea is simple. The side that cannot hold eventually gives way.
Hidden Liquidity
Not all liquidity is visible in the order book. Some traders use iceberg orders, where only part of the total order size is shown publicly.
For example:
- A trader wants to sell 10,000 units
- Only 1,000 units are displayed.
- As those 1,000 units get filled, another 1,000 appear automatically.
This creates the illusion of a smaller supply while actually masking a large position.
Hidden liquidity is common in highly liquid markets such as major stocks or large cryptocurrencies. It makes order book reading more complex because what you see is not always the full picture.
Imbalances and Momentum
An order book imbalance occurs when one side significantly outweighs the other.
For example:
- Bid side total volume is 50,000 units
- Ask the side total volume is 15,000 units.
This imbalance suggests stronger buying interest. However, it does not guarantee price movement.
Why? Because large visible bids can be canceled instantly. Momentum is confirmed only when trades execute and remove liquidity from the opposite side.
Real momentum occurs when:
- Market buys lift the ask repeatedly
- New, higher bids appear quickly.
- Sellers retreat or cancel lower asks.
Order books are dynamic. They reflect changing sentiment in real time.
Real World Example of Slippage in Action
Let us look at a realistic scenario in a moderately liquid market.
Suppose an asset trades around 200.
The order book shows:
Asks:
- 200.10 for 300 units
- 200.20 for 400 units
- 200.50 for 800 units
You decide to buy 1,000 units using a market order.
Your order will fill:
- 300 units at 200.10
- 400 units at 200.20
- 300 units at 200.50
Your average entry price will be higher than 200.10. That difference between the expected price and the average execution price is slippage.
If instead you had placed a limit order at 200.15, you might have received a partial fill at a better average price.
This is why professional traders always check depth before placing large orders. Slippage is not random. It is often predictable from the order book.
How Day Traders Use the Order Book
Short-term traders rely heavily on order book data for quick decisions.
They look for:
- Large liquidity zones that may act as support or resistance
- Rapid changes in bid and ask sizes
- Sudden cancellations of large orders
- Aggressive market orders that clear multiple levels
For example, if a large sell wall at 210 disappears suddenly, the price may jump quickly because the resistance is removed.
Similarly, if a strong bid level keeps absorbing sell pressure without breaking, traders may interpret it as strong support and take long positions.
However, order book trading requires fast execution and emotional control. Decisions must be made within seconds.
How Swing Traders Use Order Book Data
Longer-term traders do not rely on every tick. Instead, they use the order book to fine-tune entries and exits.
For instance:
- Entering near a large bid cluster to reduce downside risk
- Placing limit sells slightly below visible resistance levels.
- Avoiding market orders during thin liquidity periods
Swing traders combine order book analysis with technical analysis tools such as trend lines, support and resistance, and volume patterns.
The order book helps improve timing rather than predict long-term trends.
Common Mistakes When Reading Order Books
Many beginners misunderstand what the order book actually represents.
Here are frequent mistakes:
Assuming Visible Orders Are Permanent
Orders can be canceled instantly. A large buy wall may disappear in seconds.
Ignoring Market Context
The order book reflects short-term activity. It does not override major news events or macro trends.
Trading Only Based on Imbalance
An imbalance alone does not guarantee direction. Watch actual trade execution.
Using Large Market Orders in Thin Markets
Low liquidity increases slippage dramatically. Always check the depth before entering.
Overreacting to Small Changes
Order books update constantly. Not every flicker is meaningful.
Patience and observation are essential. The order book is a tool, not a prediction machine.
Practical Checklist Before Placing a Trade
Before executing a trade, quickly review:
- What is the current spread
- How deep is liquidity near the current price?
- Are there large visible walls nearby
- Is the order flow aggressive on one side
- What is the recent trade volume trend?
This quick checklist helps reduce impulsive decisions.
When the Order Book Is Most Useful
Order books are especially valuable in:
- High liquidity markets with tight spreads
- Short-term trading strategies
- Breakout or breakdown setups
- Large position execution planning
They are less useful in extremely low liquidity environments where the price can jump unpredictably.
Final Thoughts on Understanding Buy and Sell Orders
Learning how to read order books on exchanges gives you a deeper understanding of how markets function. Instead of reacting blindly to price movements, you begin to see the interaction between buyers and sellers in real time.
The bid side represents demand. The ask side represents supply. The spread reflects market efficiency. Depth shows liquidity. Slippage reveals execution risk.
Order types determine how you participate in that system. Market orders prioritize speed. Limit orders prioritize price. Stop orders manage risk.
When combined with chart analysis and sound risk management, order book reading becomes a powerful skill.
No tool guarantees profit. Markets remain unpredictable. But understanding how buy and sell orders interact puts you ahead of traders who ignore this data.
The order book is not noise. It is the heartbeat of the exchange.
Master it patiently, observe it consistently, and use it wisely.
Read also: Institutional Research Brief