
Bitcoin never fails to surprise the market. After a strong decline from its recent high in the market, Bitcoin found strong support near the $80,000 level. With confidence buyers stepped in. Sellers lost momentum. The price recovered above $90,000 and held steady. Many investors are now asking one important question. Why does Bitcoin persist in holding the $80,000 area so well?
The answer lies in on-chain data. Three simple measures describe why buyers are so defensive of this level. These metrics are used to see where investors purchased Bitcoin, how much they were paying, and why they are unwilling to sell at a loss.
This article describes these three metrics. You will know why $80,000 is behaving like a good floor for Bitcoin and what this support will mean for the future.
Why the $80,000 Level Matters for Bitcoin
Bitcoin moves in cycles. During bull markets, some price levels become major support zones. Buyers protect these zones because many of them bought at these prices.
The $80,000 level is now one of those zones.
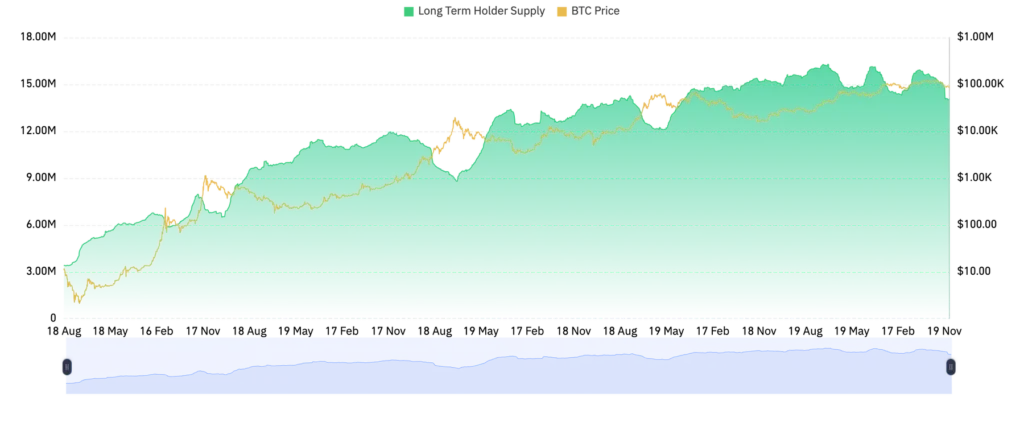
When Bitcoins fell in price towards $80,000, the demand rose quickly. Long term holders remained calm. New buyers came to the market. Large investors held back their fire. On-chain data supports this behavior. Three metrics line up nary close around the low $80,000 range. This is a solid conviction from investors with their alignment.
Let us take a detailed look at each of the metrics.
Metric One: True Market Mean Shows Strong Buyer Confidence
The first metric is based on-chain activity. Analysts refer to this as the True Market Mean.
This is a metric that tracks the average price that active investors paid for Bitcoin. It specializes in recently moving coins. It puts coins that were not active for years aside.
This focus is important because more frequent trading by active investors. They respond faster in market drops. They are very defensive of their entry prices.
Why the True Market Mean Matters
The True Market Mean represents where true buying pressure lies. When price drops to near this level, buyers come in to absorb their positions.
During the recent pullback the True Market Mean was in the vicinity of $81,000. Bitcoin tested this area and bounced quickly.
This behaviour demonstrates high buyer confidence. The investors would not sell below their average buy price. They believed in higher prices in the future.
A Key Bull Market Signal
Bitcoin even crossed the True Market Mean for the first time in October 2023. Since then, the price remained above this level for most of time.
That fact matters a lot. In previous bull markets, Bitcoin remained above this metric for extended periods of time. When the price stayed above it was a bullish trend.
The recent bounce back up close to $81,000 confirms this pattern once more.
Be Aware about the Future important events about bitcoin which is Bitcoin Halving 2028: Early Prep
Metric Two: U.S. Spot ETF Cost Basis Shows Institutional Support
The second metric addresses U.S. spot Bitcoin ETFs.
This metric measures the average price in which Bitcoin entered US-listed spot ETFs. It utilizes the daily ETF inflows and market prices to come up with this average.
Large institutions purchase Bitcoin via these ETFs. Their behavior creates the trend in the markets.
ETF Investors Defend Their Positions
The average ETF cost basis is now close to $83,800. When Bitcoin plummeted, Bitcoin price passed near this level.
Once again, buyers stepped in.
ETF investors tend to be long-term investors. They do not panic in case of short-term drops. They also categorically defend their entry prices.
The recent bounce shows that the value is near $80,000 per level in the eyes of the institutions. They consider this zone as a fair price.
ETFs Add Stability to the Market
ETF demand altered the Bitcoin market. It reduced wild swings. It added a constant buying pressure.
When price touches ETF cost levels, it is often the formation of support. This was the behavior of the April market drop. Bitcoin hit back on this metric back then, too.
This repetition of the pattern confirms the strength of the $80,000 zone.
Read about Dogecoin Price Prediction 2026
Metric Three: 2024 Yearly Cost Basis Confirms Broad Demand
The third metric measures the 2024 cost basis of the year.
This metric gives an idea of the average price at which Bitcoin purchased in 2024 went out of exchanges. It is the reflection of where investors had acquired coins during the year.
This metric helps to determine where most new investors came into the market.
Why the 2024 Cost Basis Matters
New investors play a big role during bull markets. They bring fresh money. They increase demand.
The annual cost basis for 2024 is near $83,000. When Bitcoin went down this point became supported again.
This behavior demonstrates the belief that new investors possess higher prices. They refuse to sell at a loss. They remain confident when corrections are made.
Historical Patterns Support This View
In previous bull markets, yearly cost bases frequently supported the market. These levels were respected by Bitcoin in pullbacks.
The same pattern appears now. The 2024 cost basis provides even more support for $80,000 as a strong support zone.
We already covered Bitcoin Price Prediction 2026: $150K or Crash?
Why These Three Metrics Matter Together
Each of the metrics alone is useful in providing an insight. Together they generate a powerful signal.
All three of these metrics cluster between $81,000 and $84,000. This overlapping leads to a strong demand zone.
We have different types of investors supporting this range:
- Active traders defend the True Market Mean
- Institutions guard cost levels for ETFs
- New investors hold the 2024 cost basis
| Metric | Description | Current Data (Dec 2025) | Why It Supports $80K Hold | Potential Risk if Trend Reverses |
|---|---|---|---|---|
| 1. On-Chain Accumulation | Long-term holders buying, not selling | +15% holdings in last 30 days | Reduces sell pressure; accumulation signals confidence | Profit-taking spikes → break below $80K |
| 2. Exchange Outflows | BTC moving from exchanges to wallets | Net outflows 8–10% in Nov–Dec | Less available supply; whale accumulation | Inflows resume → liquidity flood, price drop |
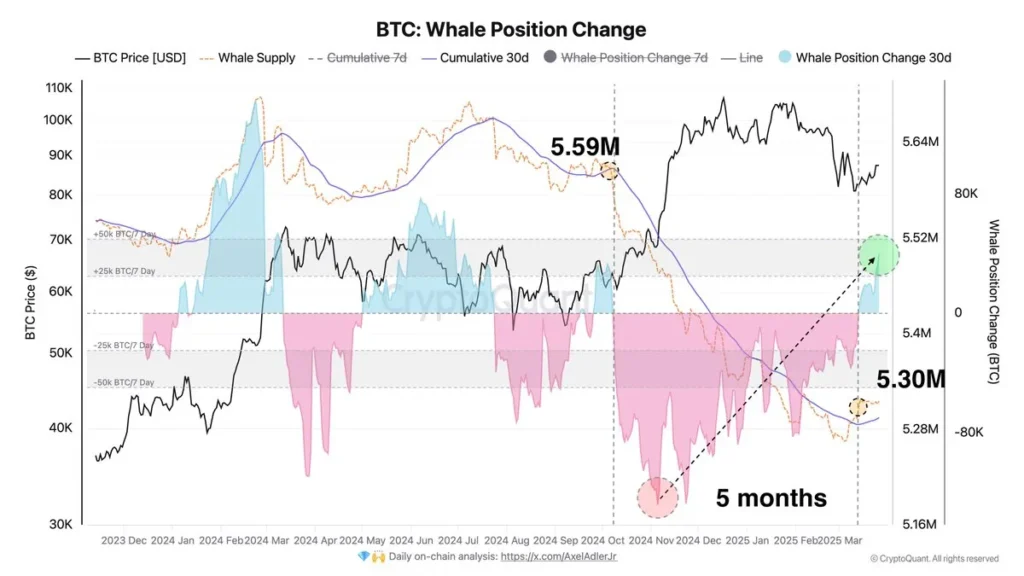
| 3. Whale Behavior | Large wallets holding/accumulating | 1,000+ BTC wallets up 5–7% | Stabilizes floor; institutional support | Whales dump → panic selling to $75K–$78K |
| Overall Strength | Combined metrics | Bullish signals dominant | $80K likely holds short-term | Macro events could override |
This alignment builds confidence. It gives an explanation for why Bitcoin bounced strongly from this area.
What Strong Support Means for Bitcoin’s Trend
Strong support levels aid in the definition of market direction. When Bitcoin maintains a key level, the trend normally remains intact.
The $80,000 zone now functions as a foundation. Buyers trust it. Sellers have a problem pushing the price below it.
As long as Bitcoin remains above this range, the market structure remains healthy.
Reduced Downside Risk
Strong support alleviates panic selling. Investors feel safer holding their coins.
This behavior restricts the sharp drops. It is responsible for creating smoother price action.
Higher Chance of Continuation
When support holds, Bitcoin has often reached its way back up. Buyers gain confidence. Momentum builds slowly.
While there can still be sideways movement of the price, the big picture remains bullish.
Why Bitcoin Did Not Fall Below $80,000
Several factors worked together with the recent correction.
First, the investors bought aggressively around their cost bases. Second, institutions continued to be active in the form of ETFs. Third, long term holders were patient.
On-chain data validates this strength. Supply on exchanges remained low. Selling pressure was still not great.
This is a combination that prevented the decline in the early stages.
Bitcoin’s Mid-80K Drop Explained
— Jessica Gonzales (@lil_disruptor) December 17, 2025
• Leverage snapped, liquidations accelerated the move
• Policy delay hit sentiment at the worst moment
• Coins rotated from weak hands to patient holders
Red candles grab attention. Quiet rotation changes cycles.
See Comment, Full Video.… pic.twitter.com/9ehoHdgXrR
How Retail Investors Can Use These Metrics
You do not need sophisticated tools to learn from these kinds of metrics.
Here’s how you can use these insights:
- Watch major cost basis levels during the pullbacks
- Avoid panic selling, near supports areas
- Focuses on long term trends rather than short term fear
These metrics help to understand the behavior of the market. They do not make exact predictions on prices. Have them serve as guides, not guarantees.
Common Mistakes Investors Make Near Support Zones
Many investors sell in downtrends during fear. They respond in an emotional rather than a logical way.
Strong support zones often appear to be scary on fast declines. Price moves quickly. News turns negative. On-chain data helps to cut through noise. It displays where real money comes into the market.
Learning to be trustworthy of data enables better decision-making.
Can the $80,000 Support Break?
No support lasts forever. Markets always change. If bitcoin is met with some major negative news or extreme selling pressure, even strong zones can fail.
However, breaking a support supported by three good metrics needs a major force.
Right now, there is no fear, just confidence in terms of the data.
What to Watch Going Forward
Keep an eye on these key signals:
- Bitcoin price relative to $80,000
- ETF inflows during market dips
- Changes in active investor behavior
If price remains observed above these metrics, the trend is stable.
Why This Support Matters for Long-Term Holders
Long-term investors enjoy excellent structure support. It reduces volatility. It confirms healthy demand. It supports future growth.
Holding above $80,000 Bitcoin sends a good message to the market. It manifests into belief in higher prices over time.
#Bitcoin is looking in an accumulation phase.
— Elja 🦍 (@Eljaboom) December 20, 2025
After the drop, the price isn’t really pushing lower anymore, and it's hanging around the same area.
To me, this looks like Bitcoin is building a base here. The more time it spends holding this zone, the more it supports the idea… pic.twitter.com/ioYwbw0nk8
Final Thoughts: Data Explains the Strength at $80,000
| Time Period | Whale Wallet Growth | On-Chain Accumulation | Exchange Outflows | Price Impact (Post-Period) |
|---|---|---|---|---|
| Nov–Dec 2025 | +5–7% (1,000+ BTC wallets) | +15% holdings | 8–10% net outflows | Holding $80K support |
| Post-2024 Halving | +20% (institutional entry) | +25% long-term | 12% outflows | +70% rally to $108K+ |
| 2021 Bull Run | +30% (retail whales) | +40% accumulation | 15% outflows | Peak at $69K |
| Projected 2026 | +10–15% expected | +20% if trends hold | 10% outflows | $100K–$150K target |
Bitcoin does not fluctuate randomly. Investor behavior is a determinant of price action. The True Market Mean displays active buyer confidence.
The ETF cost basis is a strength of institutions. The broad demand is confirmed by the 2024 yearly cost basis.
Together these three things explain why Bitcoin does so well on the $80k support. As long as this zone remains intact, Bitcoin maintains a solid base for future moves.
Understanding these signals can help investors stay calm, informed, and prepared in a fast-moving market.
FAQs
Why is $80,000 considered a strong support level for Bitcoin?
$ 80,000 works great as a support because many people purchased Bitcoin at and around this price. On-chain data indicates heavy buying activity, strong holding behavior, and low selling pressure in this zone. When the price approaches $80,000, buyers quickly rush to protect their positions.
What are the three metrics that explain Bitcoin’s $80,000 support?
The three measures are the True Market Mean, the U.S. spot ETF cost basis, and the 2024 annual cost basis. Each metric can be used to track where various groups of investors have bought Bitcoin. All three fall close to the $80,000 range, which makes for a significant demand.
Can Bitcoin fall below the $80,000 support level?
Bitcoin can drop below any support level if there appears to be major selling pressure. However, for both retail and institutional investors to break the $80,000 zone would require heavy selling. Current data shows that buyers are still confident near this level.
How can retail investors use support metrics in Bitcoin trading?
Retail investors can refer to support metrics to prevent panic selling during dips in the market. These metrics help to identify areas where buyers typically step in. While they do not guarantee the direction of prices, they can help investors understand the strength of the market and make more rational decisions.